Profiles in Coffee Roasting
In the past couple years, we have dedicated much attention on our blog on several heady topics such as green coffee, coffee roasting, and even the gear surrounding all of the different facets of the industry. In an effort to get more granular, this article will take a deeper look at the art of roast profiles. First, we’ll cover what a roast profile is, next we will talk about its different variables, roast profile details, and, finally, we’ll look at profiling different coffees.

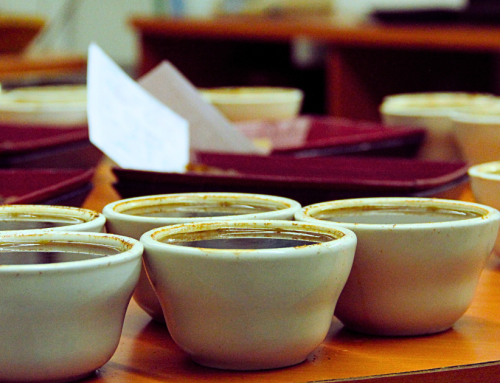
Coffee Roaster checking the roast level while roasting coffee Img: Juan Jose Napuri Guevara
In my experience as a head coffee roaster, profiling a new coffees happened just about every day. “Profiling” a coffee simply means you are figuring out how to roast that specific coffee to highlight its best attributes, or to figure out how to roast that coffee to fit a specific need. As an example: say you have a sparkling Ethiopian single origin. You might want to roast that coffee to show off its bright acidity and its more delicate notes. This typically means roasting on the lighter side. In contrast, you’d probably approach a Brazil that is meant for a blend differently. You might want to target more development in order to pull out those rich chocolaty notes. All of these details are the thought processes when profiling coffee. You must ask yourself, what am I trying to do with this coffee, and what is the coffee trying to tell me? Initial profile roasts of coffees often give a roaster data about the coffee to be used to refine future roasts. It is very rare to get a perfect roast on the first attempt. Sometimes it happens, but the data gathered from an initial profile roast will tell you all that you need to know about a coffee.

Coffee Roasting Machine in coffee roastery – IsaEva | Getty Images
Roast Profile Variables Keeping Track
Some roasters love roasting the old-fashioned way. Often called ‘sensory roasting,’ this involves putting the coffee in the drum, then using sight, smell, and sound to know when it’s done roasting. These are great skills to learn, but roasting can be a science as much as it is an art. Your roasts can be honed and perfected by the application of data. And, a data-driven approach to roasting can make any roaster’s life a lot easier. If you are not keeping track of your variables, profiling a coffee will become a Sisyphean task (ie – you’ll be doomed to an eternity of pushing a boulder up a hill only to have it roll back down on you every time).
Batch Size
The batch size is the first key element to keep consistent. Batch size is the variable that will have effect everything else. Most roasters are rated for 100% batch volume; I suggest you think twice about that. Personally, I would recommend 85% capacity – depending on the roaster – but it also depends on how much energy you have present from your source. If less heat is available, you may need to decrease your batch size. I have had success between 65-85% total drum volume in the past, so this is a good starting reference.
Charge Temperature
The Charge Temperature is refers to the temperature you start your roasts. This can vary heavily between different roasters. For single walled gas drum roasters, it can be from 385-400 degrees. On something like a Diedrich IR (double walled), I’ve had success with between 430-440. The way I would find optimal charge temperature on a given machine is by testing what allowed for a turnaround on the roast curve by 1-1:30 into the roast time. This is usually a good indicator that you have appropriate energy to carry a roast through.
Airflow settings
If your airflow setting are not fixed, it can allow for another element of control in the roasting process. Scott Rao has an article about tuning your machine which details how to spot issues with airflow.

Fresh roasted coffee beans Img by Изображения пользователя Yaroslav Astakhov
Other Important Tips
- Establishing a High temperature gradient. This means you start your roast by establishing ample energy to carry the roast all the way through without temperature stalling. You always want to start with a lot of energy, then step down your application through the roasting process.
- Target time and temperature. After working with a roaster for a bit, you will get to know its tendencies. On most drum roasters, for well developed light roasts, you can target first crack around 8-9 minutes with a total roast time between 10 and 12 minutes and an end temp around 400 degrees.
- Make sure your machine is well calibrated where the probes and ventilation are calibrated and cleaned. This is the best way to get consistent results. I recommend finding out how much gas pressure is available, the actual drum speed of your roaster, and if your probes are calibrated in the roast logging software.
Parts of a Roast Profile and Reading Graphs
If you plan on reading and analyzing Roast Profile graphs, you’re going to want to be familiar with key terminology like:
- Charge/Start Temperature – the temperature at which you charge the drum and start the roast
- End Temperature – the temperature at which the roast ends / the final temperature of the coffee
- Bean Temperature – a measure of heat described in Fahrenheit by the probe immersed in the bean pile within the drum. This tells you the approximate temperature of the coffee, and can be used to measure drum temp before and after a roast cycle.
- Exhaust Temperature – a measure of heat in Fahrenheit by the probe reading the outgoing exhaust. This can be a great indicator of the environment in the drum, and can give you faster indicators as to where the roast is heading before the bean temp probe catches up.
- Rate of Rise (RoR) – how quickly temperature increases over a specific period of time. RoR can be used as an indicator of roast momentum.
- Peak RoR – the highest point on a roasting curve where the bean’s internal temperature is increasing at its maximum speed. This is used to measure the momentum of the energy in the roast and guide your adjustments, with the ideal being a steadily declining RoR which creates balanced flavor development.
- Turning Point – where the temperature of the beans, as measured by a probe, stops falling and begins to rise. It sort of marks an energy equilibrium, where the room temperature coffee and the hot drum synchronize and begins to rise.
- First Crack – as a coffee bean is heated, its internal moisture turns to steam and creates pressure. This pressure causes the bean to expand and “crack” open, which presents as an audible pop or crack.
- Development Time – the time in a roast after first crack. This variable is subjective, but I personally target 16-20% DTR, depending on the origin.
- Development Time Ratio (DTR) – a metric in coffee roasting that defines the development phase of the roast as a percentage of the total roast time
- Duration – the total time of a roast cycle
The graphs below are a measure and visualization of heat being applied to coffee beans during roasting. The first one is a reference profile for the roast and the second is the logged adjustments of gas and airflow, which are what create the changes in the roast curve. When the two graphs are viewed together they tell a story about how the coffee reacts to receiving energy in the roaster.
This is a graph of a Roast that I logged in Cropster. It was a 15lb batch roasted on a Diedrich IR12. This coffee was a Honey Processed Villa Sarchi from Costa Rica that I wanted to roast light, but well developed, in order to highlight its praline sweetness, and plum jam acidity. All of this data is measured by a roaster’s probes.
In this example, I have one reading the exhaust temperature of the roaster, and one reading the temperature within the bean pile. On the left, you can see temperature as measured by the probes. The X axis is timeline. The numbers on the right side of the graph are rate of rise. The yellow line measures the exhaust temperature, which gives you an idea of the changing environmental temperature inside of the drum. The V shaped line is the measure of temperature at the bean probe, which can effectively be recognized as the bean temperature itself. When people say “roast curve”, they are usually referring to this. The mountain shaped blue line on steady decline is the coffee’s rate of rise, which is the speed at which the coffee’s temperature increases over a period of time.

Coffee Roast Profile chart output from Cropster
The second chart shows how the gas and airflow changes. The roast curves above are the direct outcomes of the changes made by manipulation of gas and airflow. In a typical roast, you want to start with enough energy to carry the roast along to the end, while making gradual adjustments. You can see as the gas is stepped down, the rate of rises follows. As first crack approaches, you can see the airflow adjustments to account for the potential jump in temperature that comes along with it. Roasting coffee is all about the interplay and balancing of variables.

Gas Comments and Airflow Comments chart output by Cropster
In the Gas comments figure, you can see the gas measured in water columns (WC) over time and the adjustments logged as I decreased the gas throughout the roast. In the Airflow comments figure, I have the IR12 set to its optimal airflow at 50%, and open it around first crack to allow more air to cycle through the drum. This helps account for any temp instability caused by first crack itself. Increasing airflow around first crack can help stabilize the environmental temperature in the drum, thus keeping the energy transfer to the coffee smooth.
When looking at the Gas and Airflow figures, you can see there is a direct correlation from the changes in these two variables to the profile graphs above. Gas decreases, and so does the Rate of Rise.

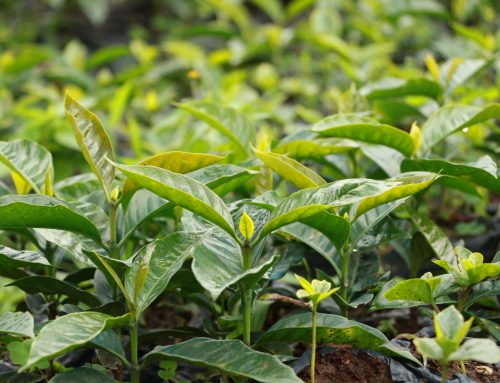
The Q-grading team at Molinos de Honduras cupping coffee
ABC – Always Be Cupping
Data is great in theory, but you need to know how to apply it. Learning about coffee profiles and their terminology along with how to apply the knowledge is the first hugely beneficial step in mastering coffee quality and consistency. Equipped with this information, a roaster should then cup and taste the coffees along with roast data in order to visualize how changes in the roasting process can change flavors present in each coffee. The more you cup and assess roast data, the more you will know about cause and effect. With the principles suggested in this article and a willingness to experiment, you’ll be mastering roast profiles and consistency in no time at all.